Introduction#
The COVID-19 Disease Map is an open-data repository of curated diagrams and models of molecular mechanisms implicated in the disease. The molecular pathophysiology of COVID-19 is complex and spans multiple biological pathways and cell types. The COVID-19 Disease Map helps to understand the disease from a systems perspective. The visualization of the networks is generated by MINERVA Platform - a standalone webserver for visual exploration, analysis and management of molecular networks encoded in systems biology formats. The map is accessible via a web browser here: COVID-19 map.
Further in this section, the basic MINERVA features are described, so you can start browsing and searching through the COVID-19 Disease Map. To find out more about MINERVA Platform functionalities available in the map, go to MINERVA Platform manual.
How to work with the map in the nutshell#
This paragraph is a really brief information about how to work with the COVID-19 Disease Map. Details are described in the following sections. There are two ways to browse and search the COVID-19 Disease Map. After opening the map here, you see in the center the map and the menu on its left, called Left Panel (see image below). The main view of the map is a glyph with light blue hexagonal interactive buttons (called anchor points). Clicking on any of these buttons displays name of associated submap in the Left Panel. Click on the submap’s name in the Left Panel, to view the submap. The second way to display the submap is directly from the SUBMAPS tab in Left Panel. Just click SUBMAPS, and then click on the magnifying glass next to submap’s name.
You can also check, for a quick start the MINERVA Quick Reference Guide.
COVID-19 Map display#
The COVID-19 Disease Map is available in any browser. The main display of the map is presented on the image below. The main part of the view is the visualization of the networks. You can freely pan and zoom the map with +/- icon in the top left corner of the map.
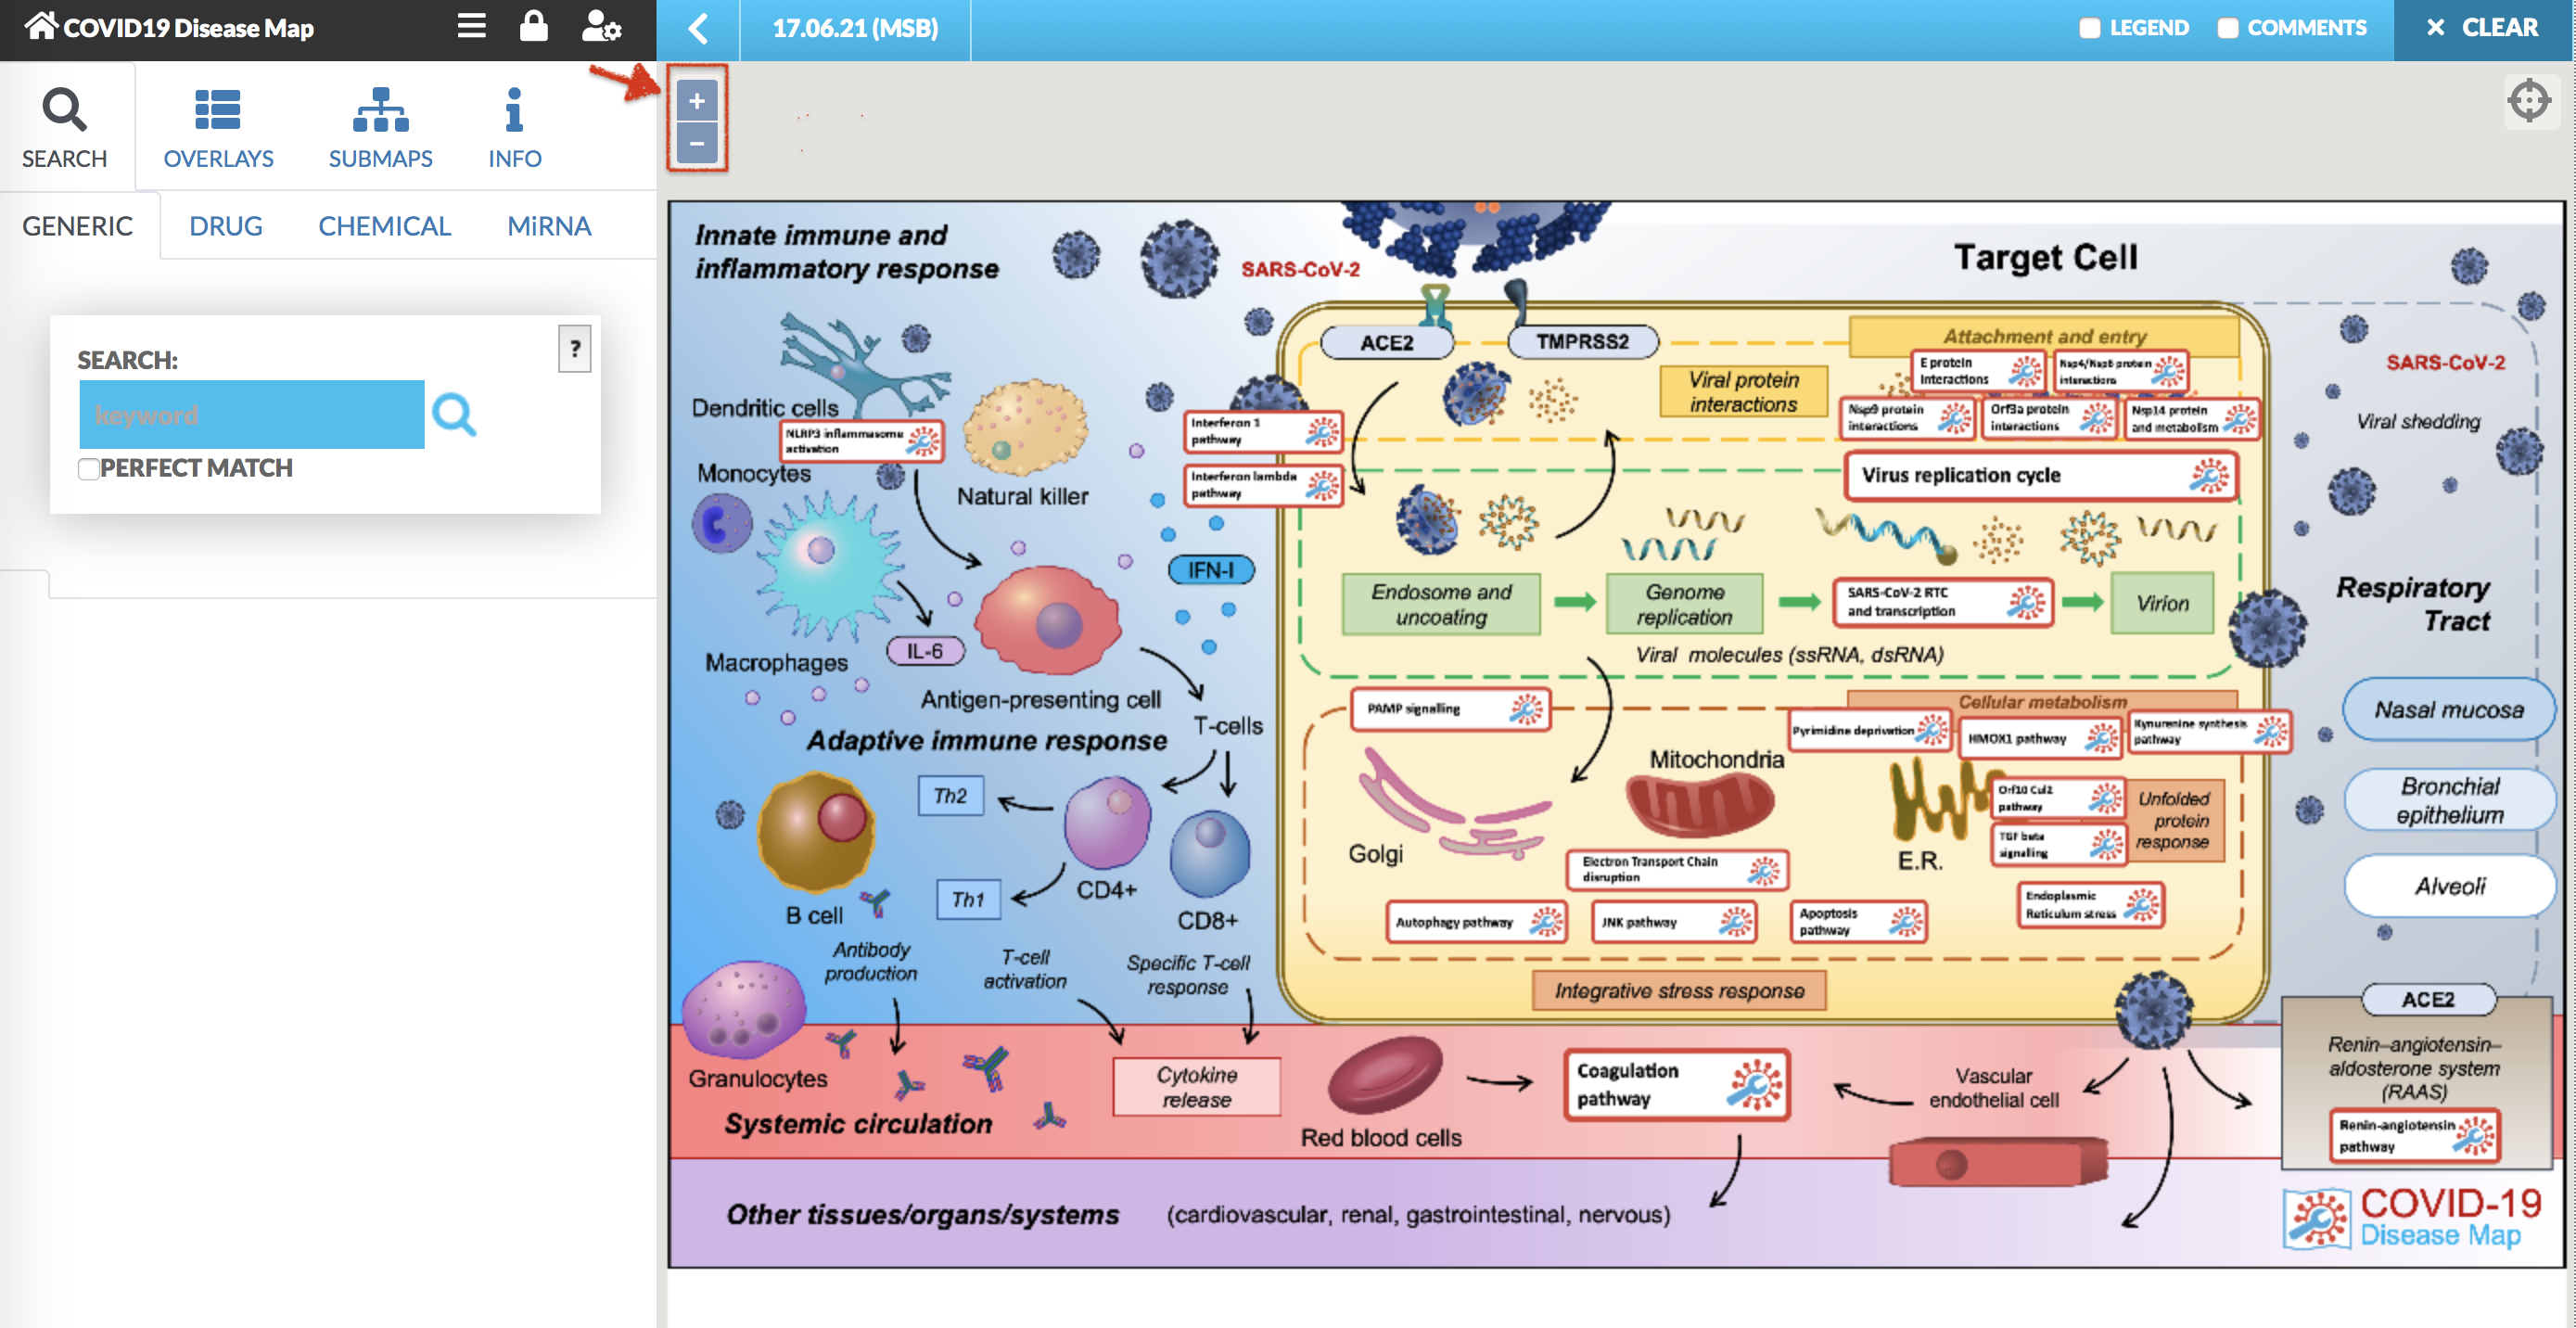
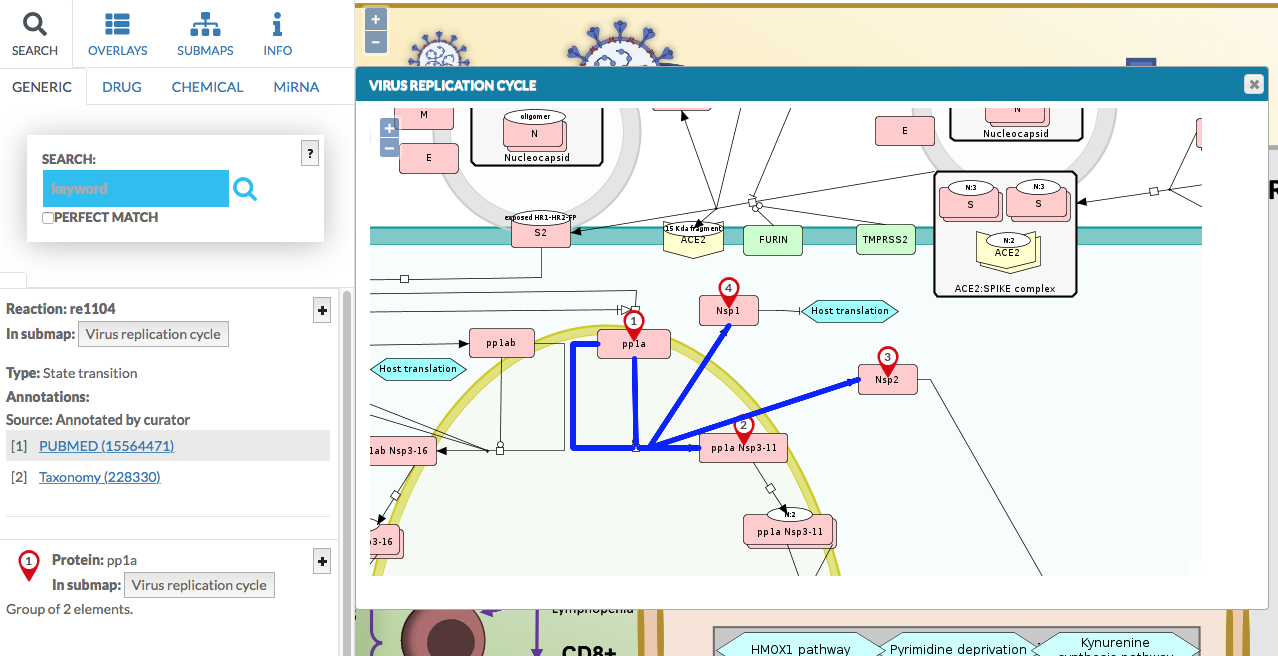
The map main view is a glyph with the interactive buttons, we call these the anchor points. Clicking on any of the anchors allows to view and browse the submaps with a particular pathways. The anchor is represented by as a white background red border rectangular, see below image.
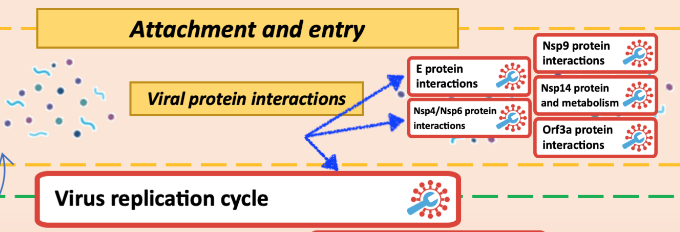
Click on the anchor is marked with the red pin. To enter the submap, click firstly on the anchor, and then click on the associated button in the left panel (see below).
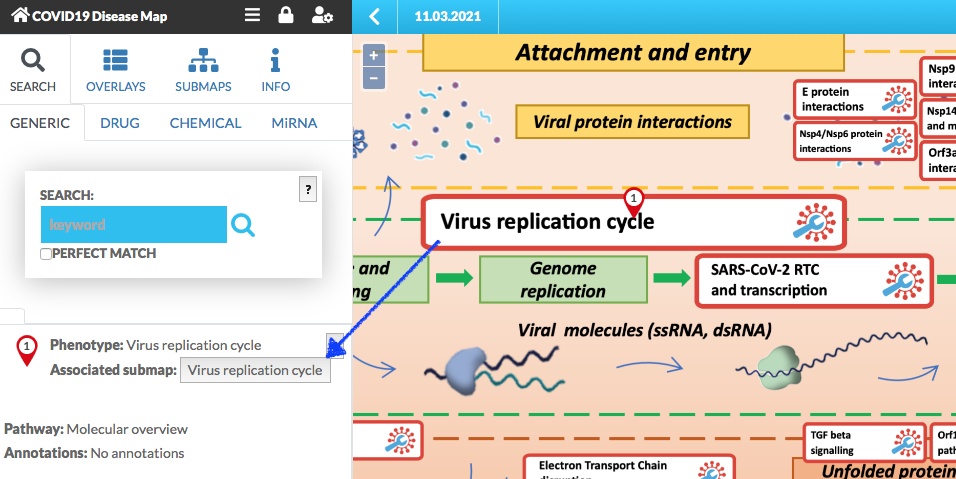
The submap is displayed (below image). You can pan and zoom it.
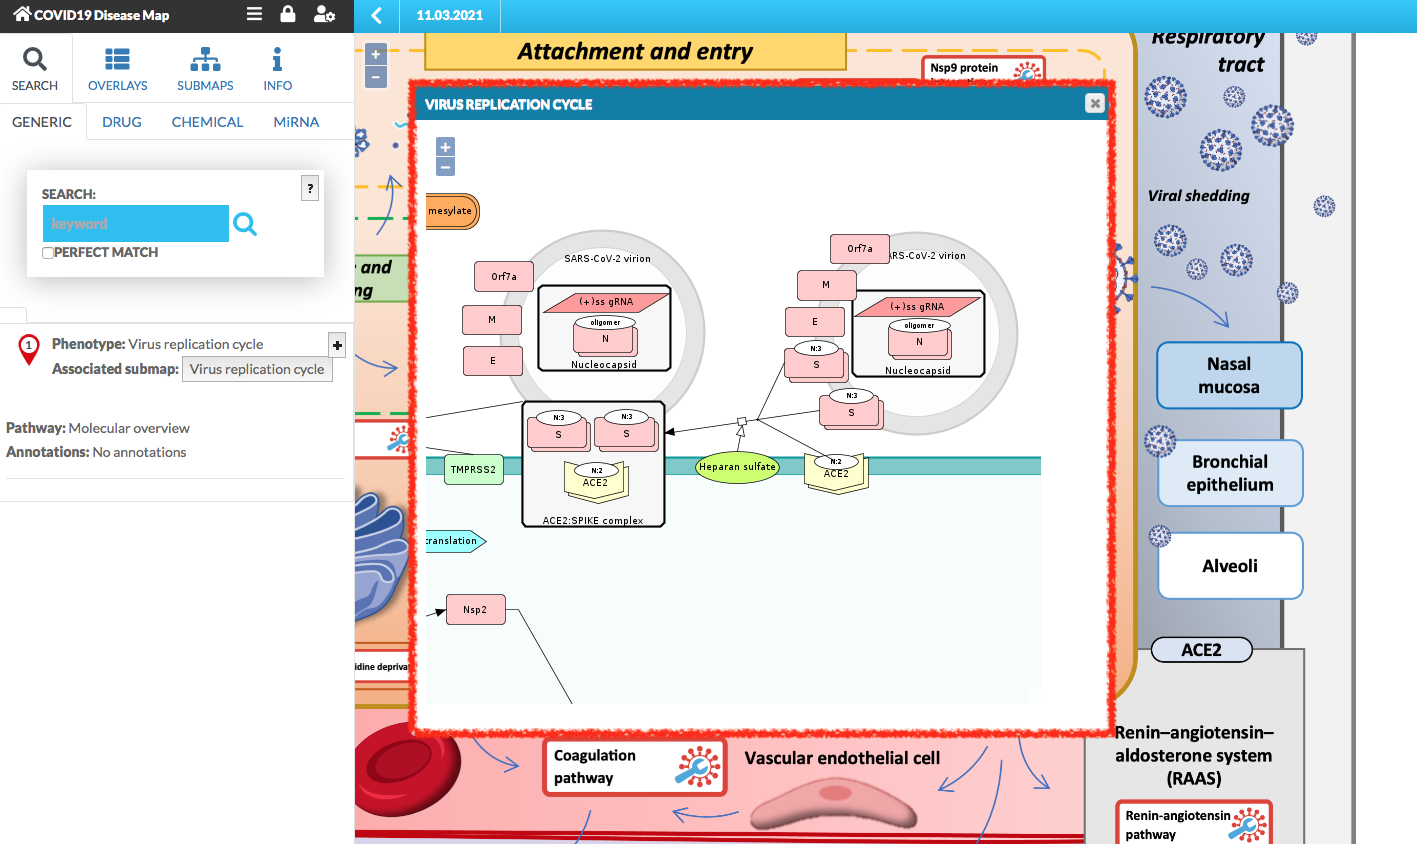
You can click on the elements and the interactions between them, their details are displayed in the left panel.
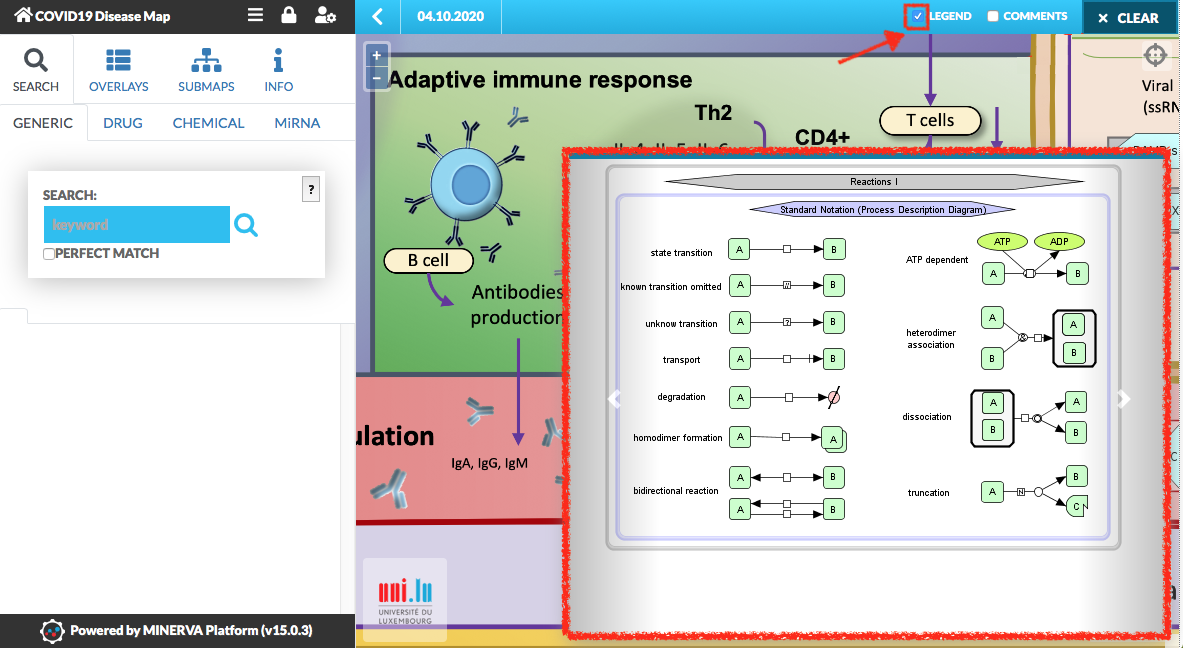
The legend#
The entities (proteins, genes, etc.) and the reactions between them, are explained in the map’s legend. To view the legend, click the checkbox in the top right corner of the map.
Comment the content#
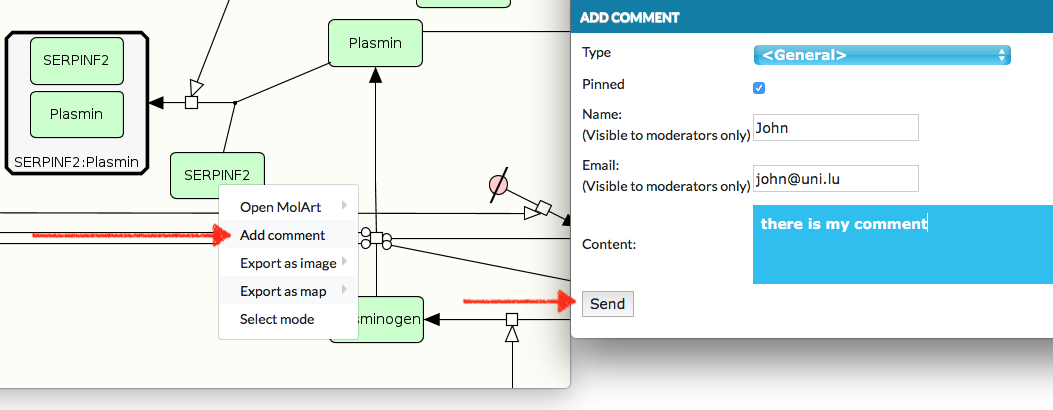
MINERVA allows to leave a comment on the map. To create a comment you need to:
open context menu with right click on the map area, where you would like to leave a comment;
choose form the context menu Add comment;
the dialog is open, fill it and click SEND (left bottom corner button).
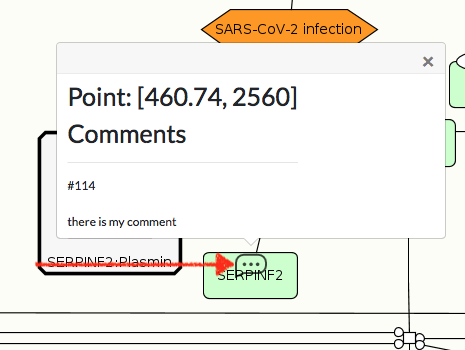
To see the comment on the map, click checkbox COMMENTS in the top right corner of the map. You will see ‘bubble’ icon on the map. Click on it, to view the comment content (image below).
Left Panel#
On the left side of the map, there is Left Panel. It contains features which enhance the map browsing and the diagram analysing, like search an entity in the map, view a submap or display the omics data.
Search#
Search function is divided in four categories. To search for any gene, RNA or protein use search bar in GENERIC tab. If you are interested in checking the targets of the particular drugs or chemicals, use DRUGS or CHEMICALS tab. To search for targets of miRNA, user MiRNA tab. You can search for multiple entities in one search, use ; between the terms, e.g. ‘TAFI ; PLAU’. To clear the search results or currently highlighted elements, click CLEAR button (top right corner of the map).
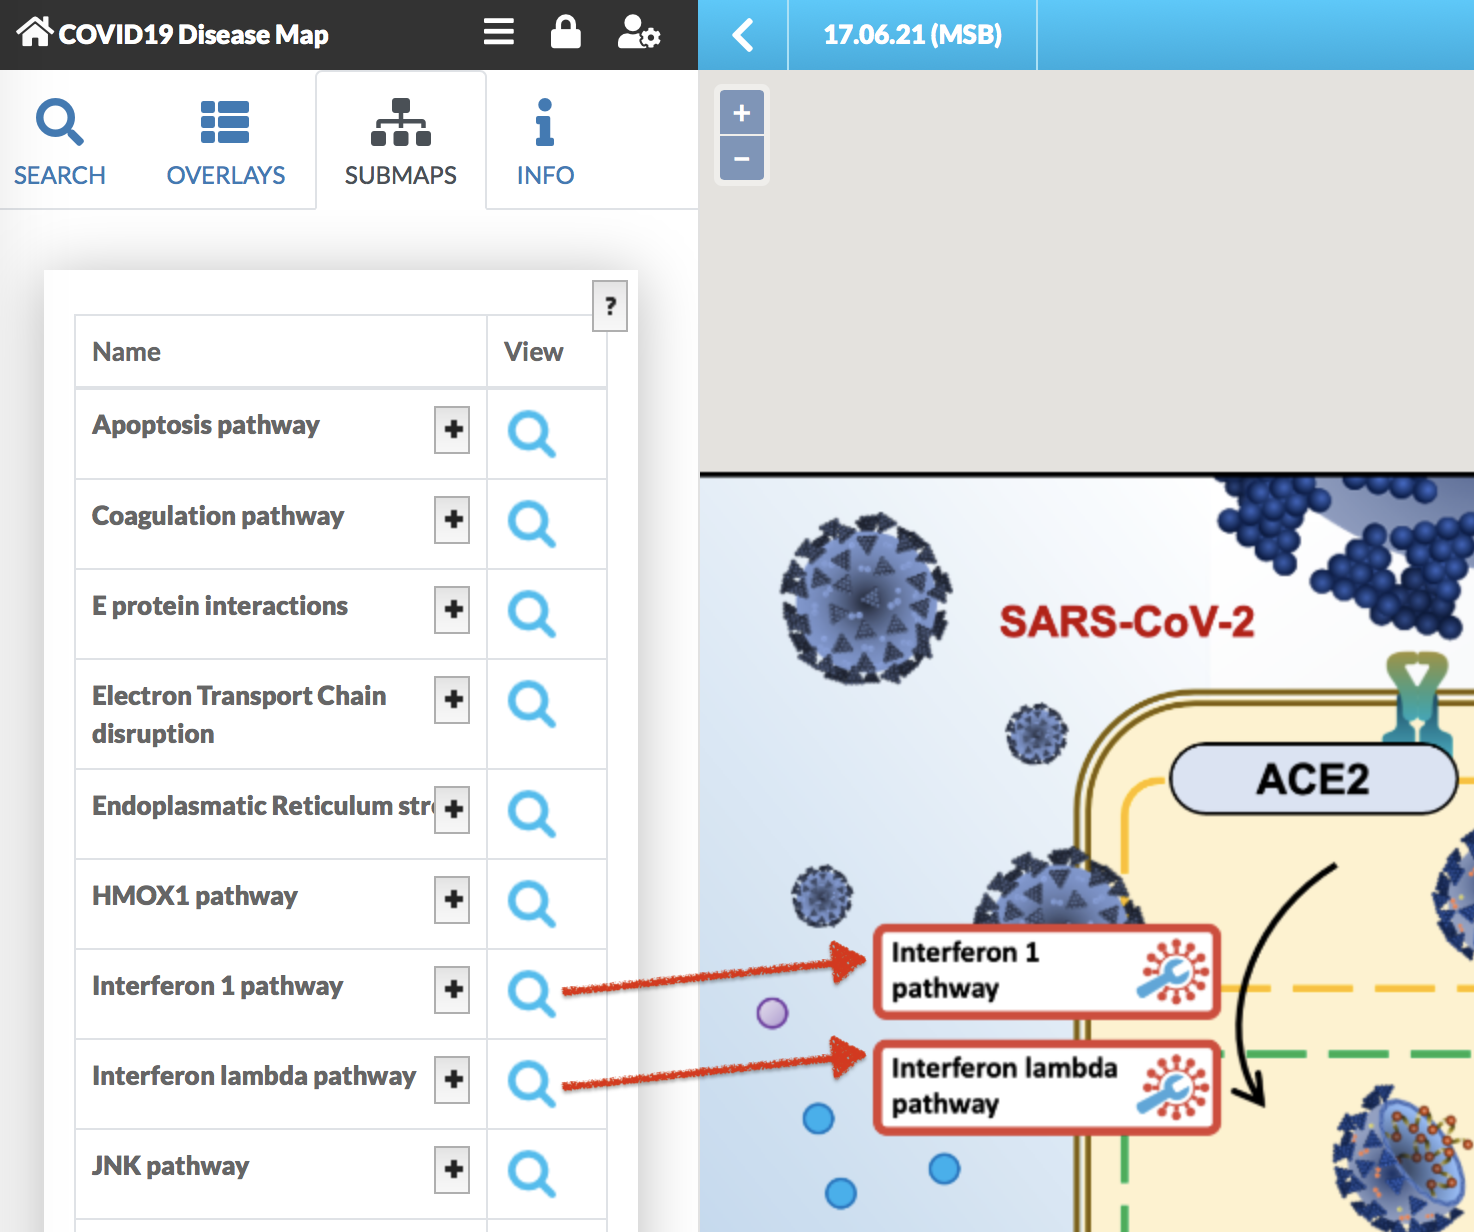
Submaps#
The main view of the map is represented as a glyph with anchors to the particular submaps. Go to SUBMAPS tab in the Left Panel to display the list of all available submaps. Click on the magnifying glass next to submap’s name to view the diagram. The + icon next to the submap’s name reveals its description.
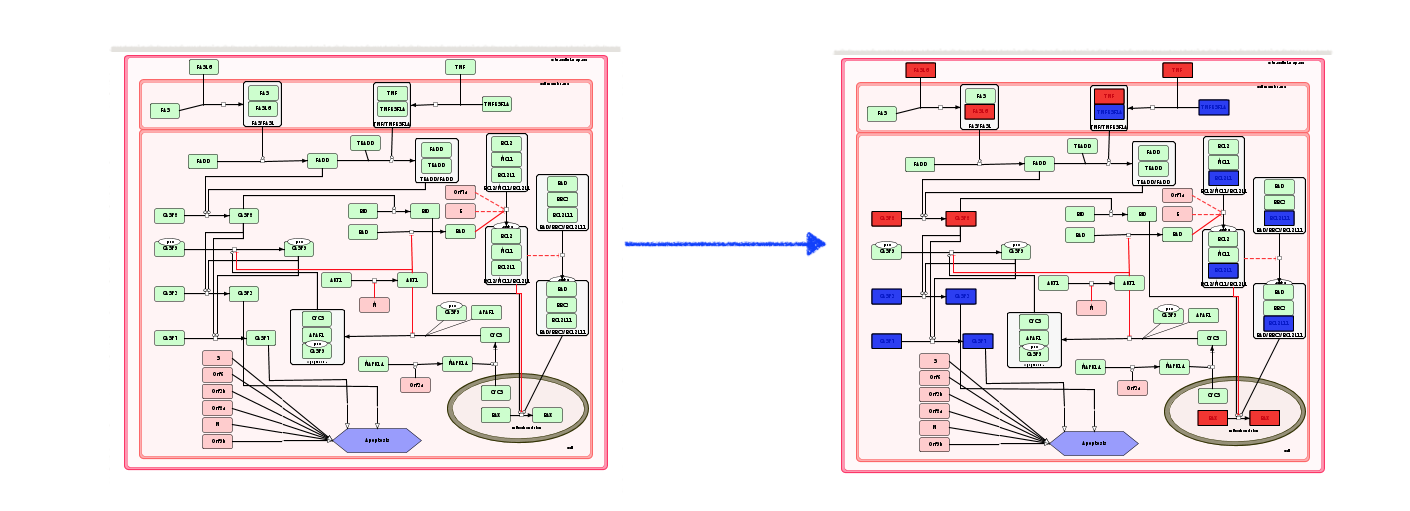
Visualise omics data#
You can upload your own omics data, and visualize them on the map. This feature is mostly use to analyse gene expression in the model, and is available for registered users.
COVID-19 Disease Map contains default overlays, available in the OVERLAYS tab (see image below). The Network is the general view of the map. The following overlays Airway secretory cells, Airway ciliated cells, Infected Ileum Immature Enterocytes and Bystander Ileum Immature Enterocytes highlight the map with the gene expression. By clicking on the checkbox View, the map is coloured with these data overlay. (see image below)
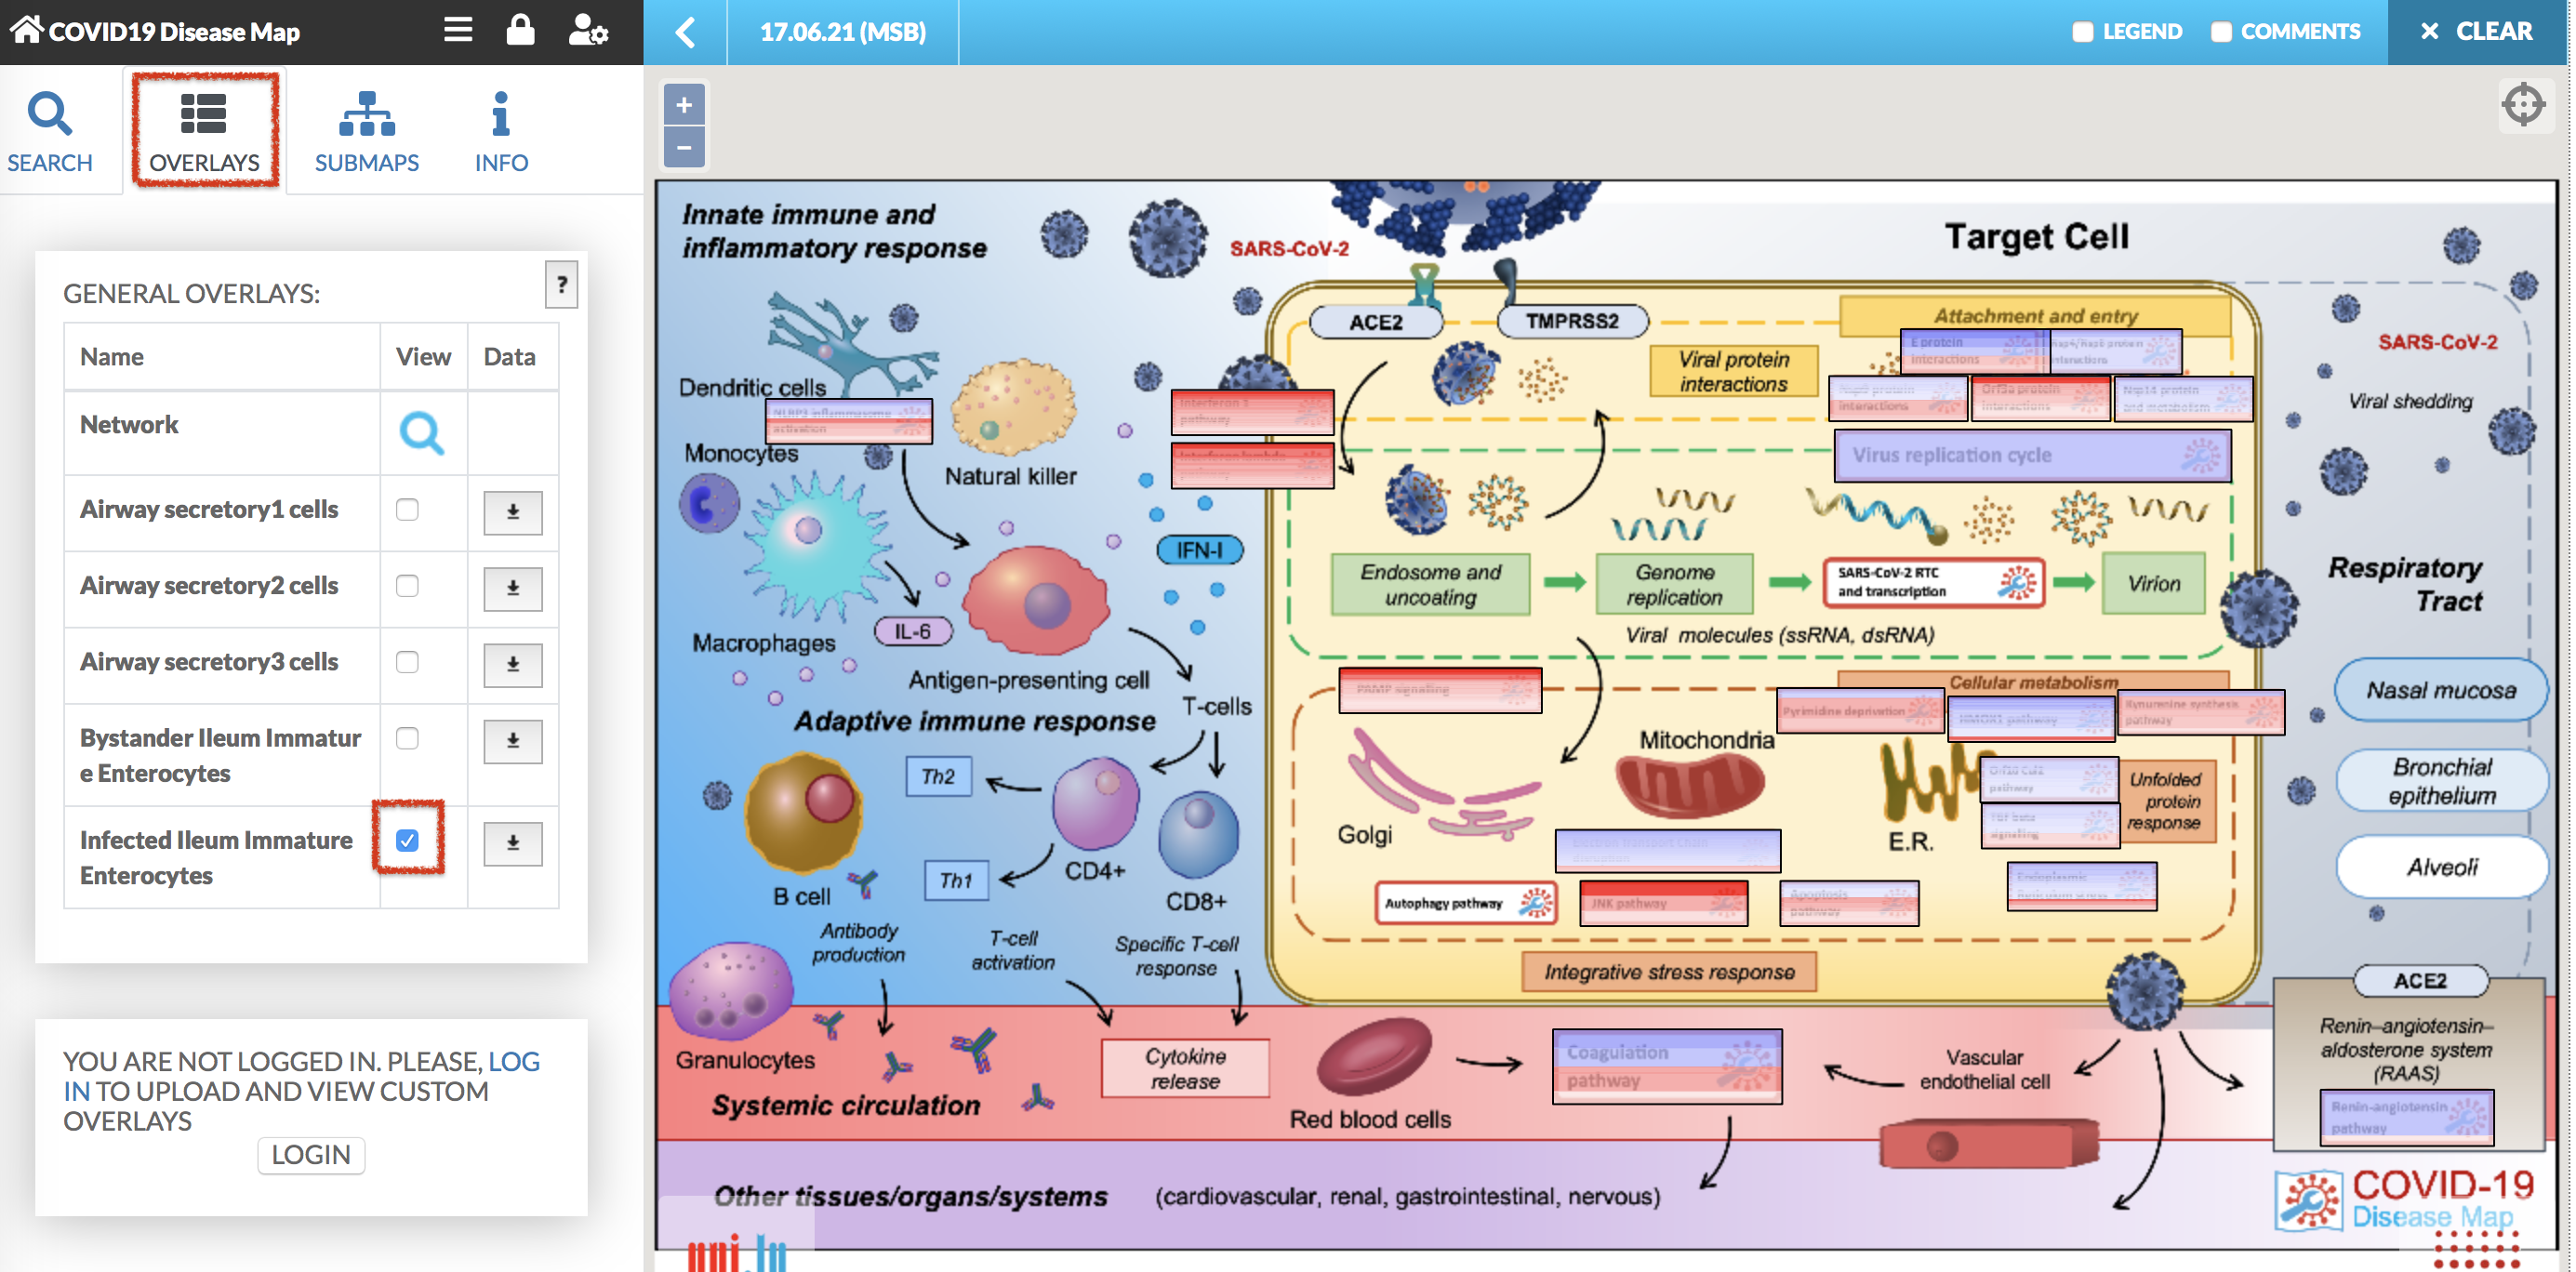
In the submap view, the display of overlay is presented below. Find out more about uploading your own omics data in MINERVA manual.
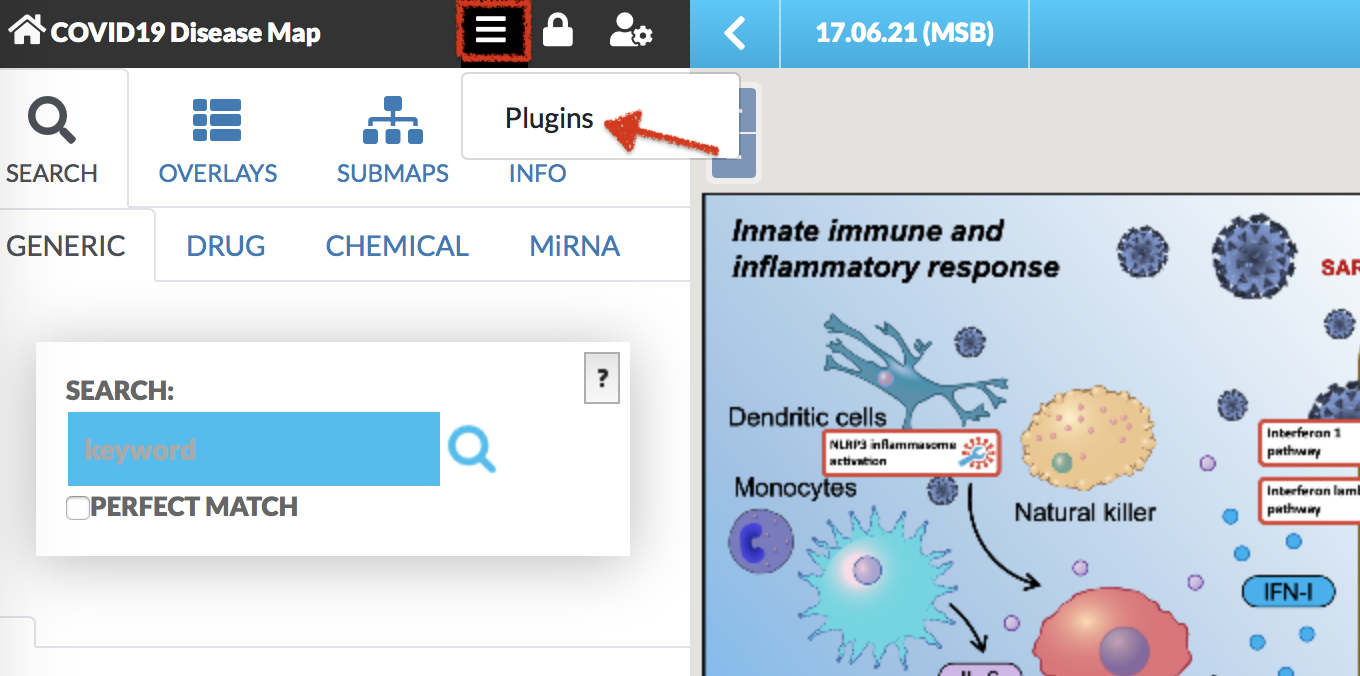
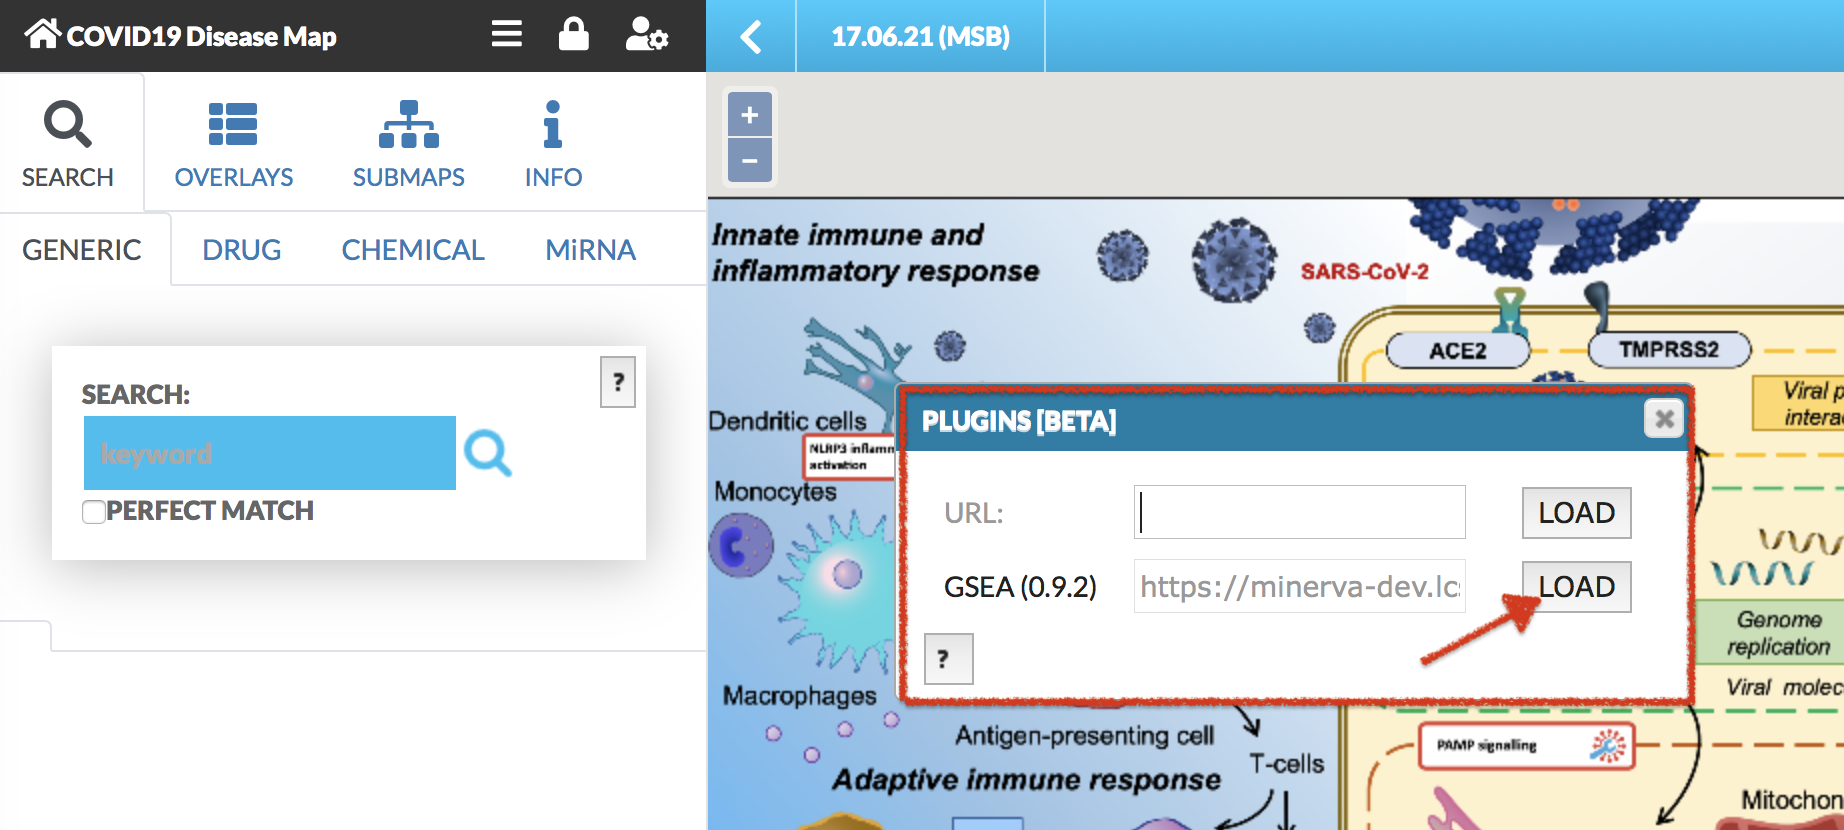
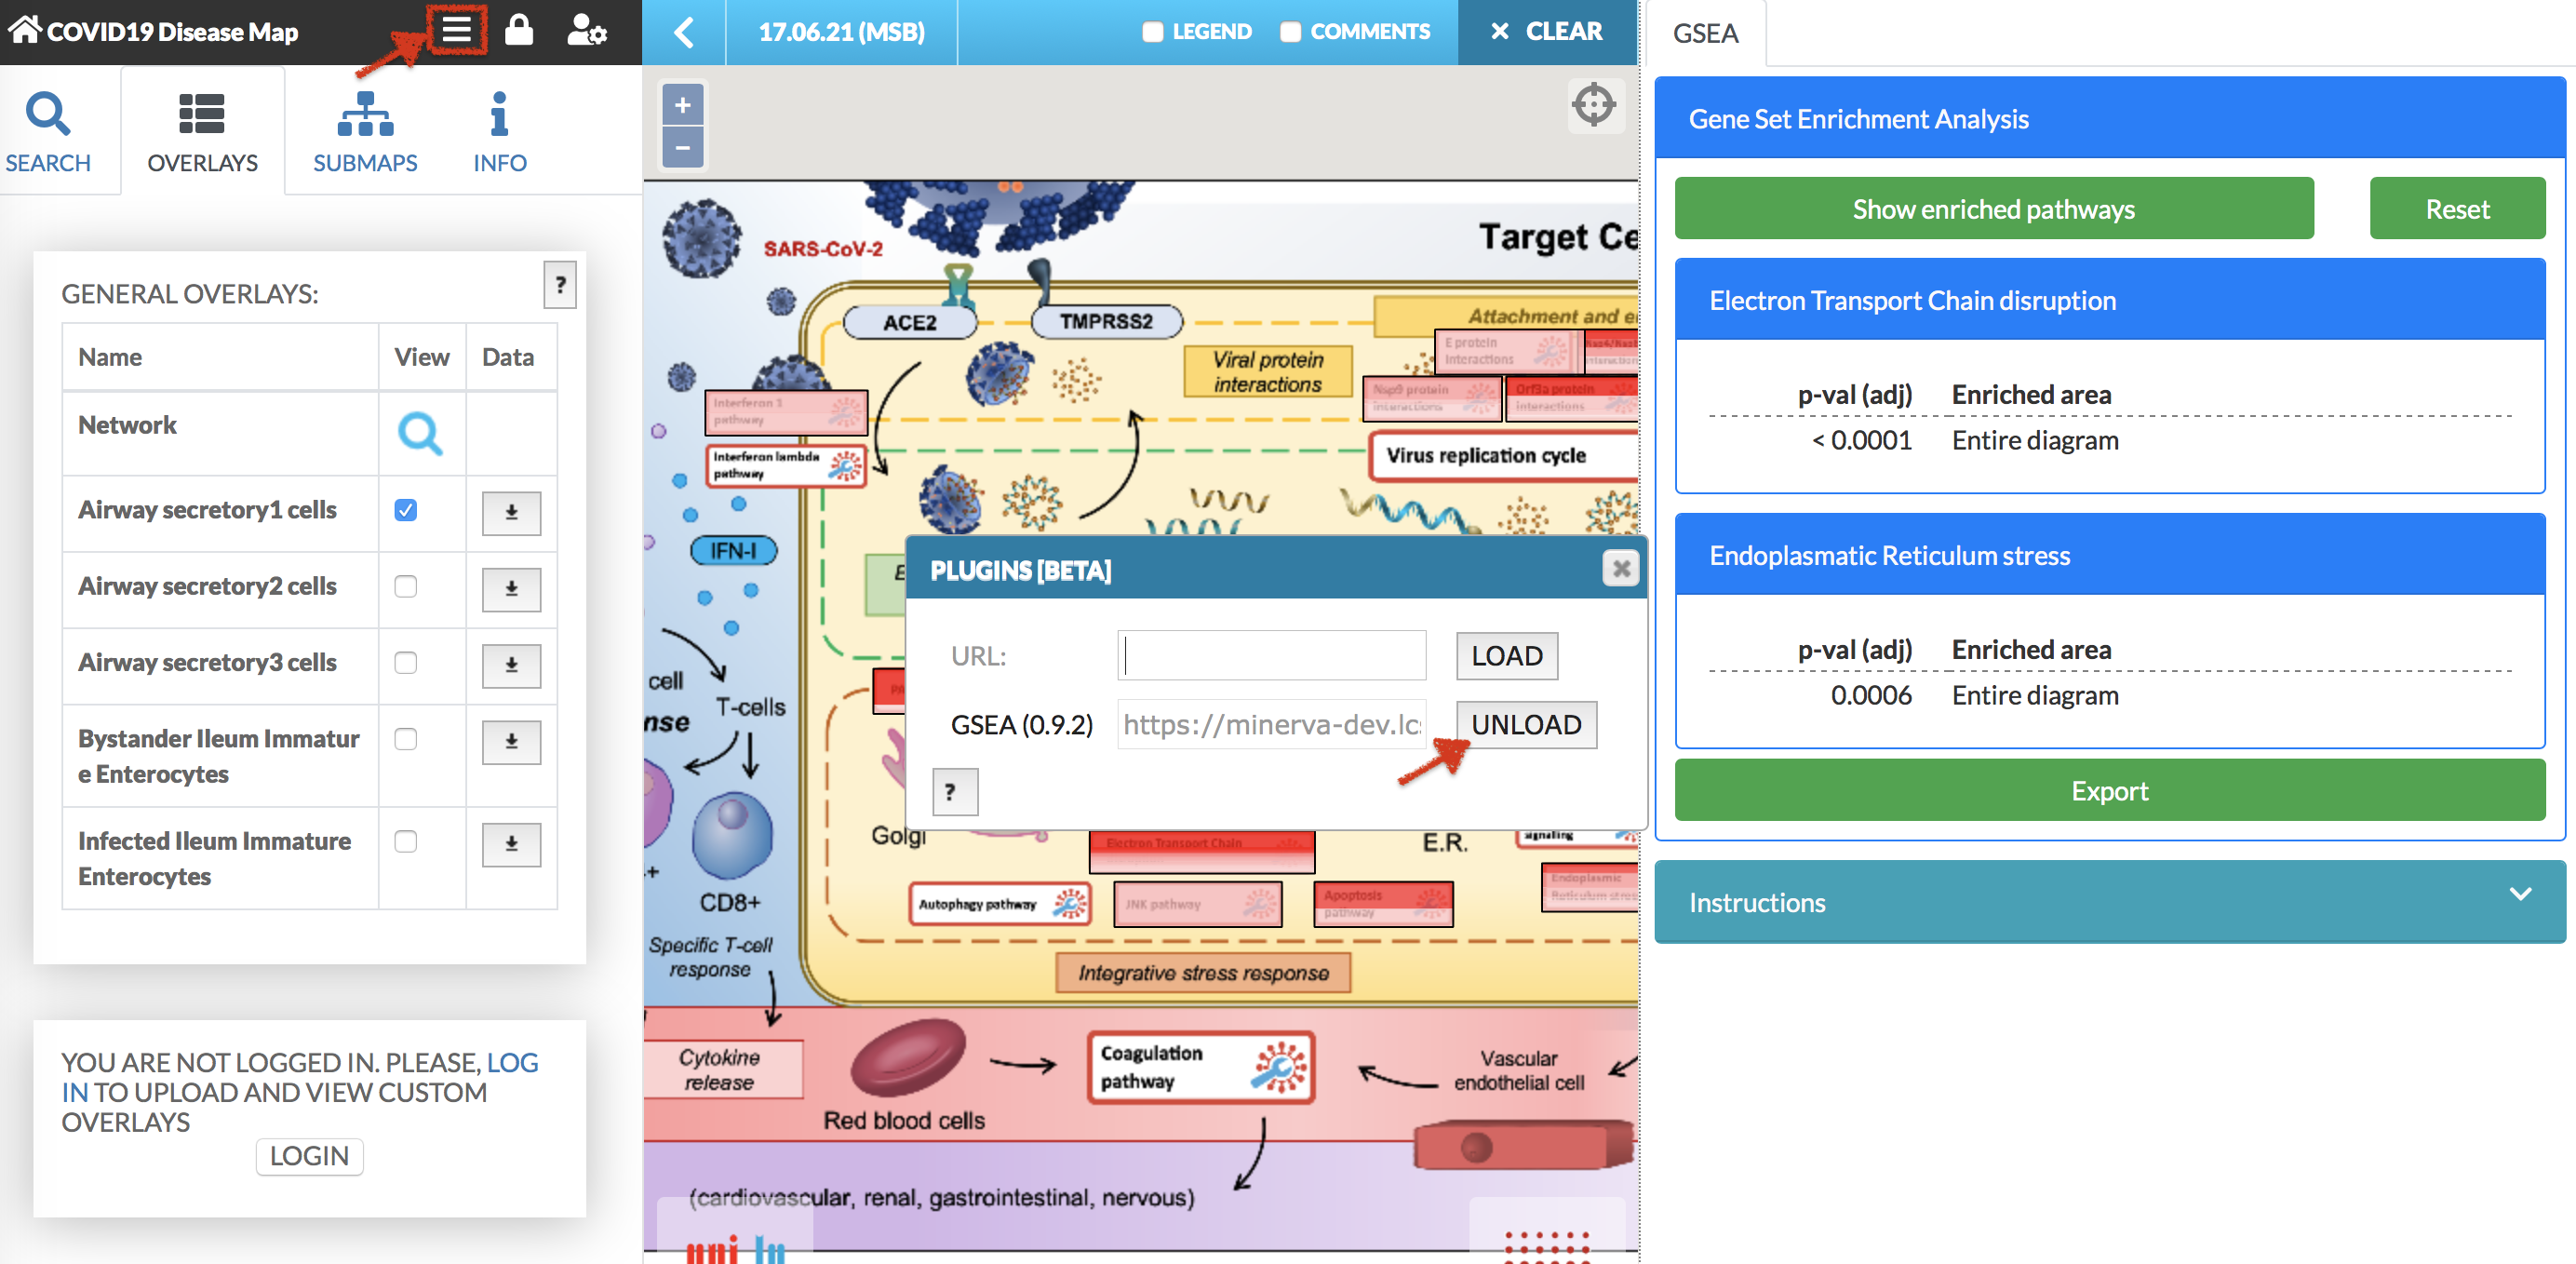
Gene Set Enrichment Analysis (GSEA) plugin#
Plugins allow for creating client-side custom visualizations, independent from the core functionalities of MINERVA. After clicking on the plugin icon, a popup window load GSEA plugin becomes available (see images below).
After clicking LOAD plugin, GSEA plugin is displayed in the right panel of the map (see image below).
Gene Set Enrichment Analysis (GSEA) plugin calculates the enrichment of the elements from the selected overlay in the pathway. Note: User-provided (private) overlays can be analyzed only when a given user is logged in.
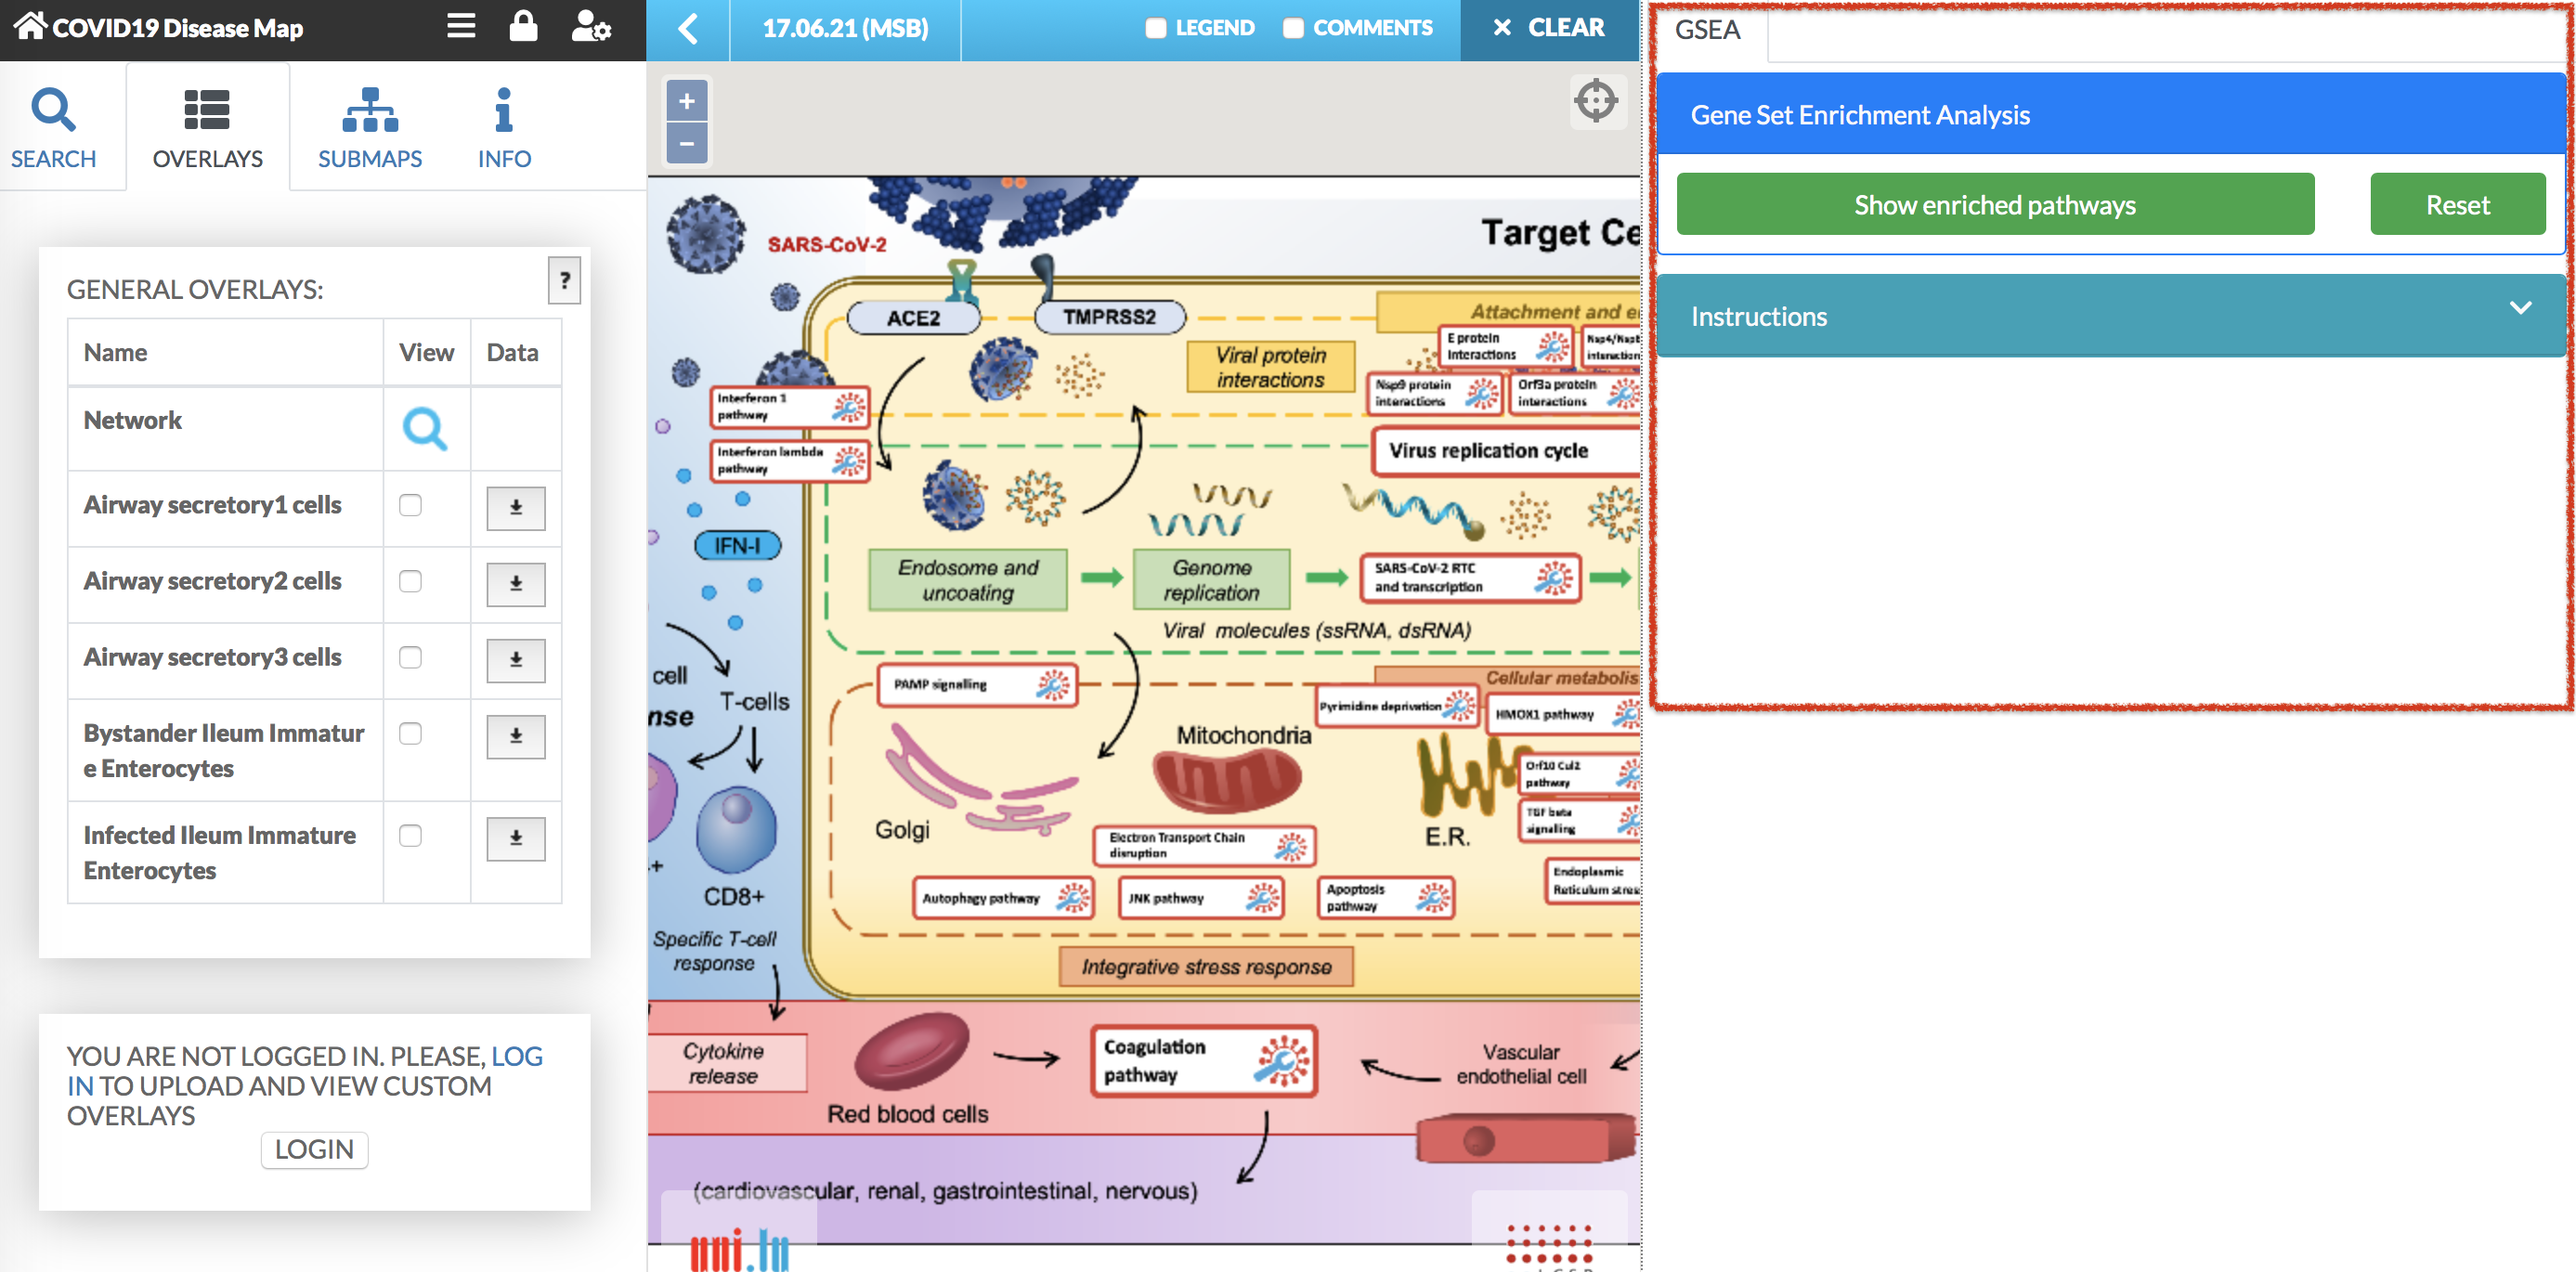
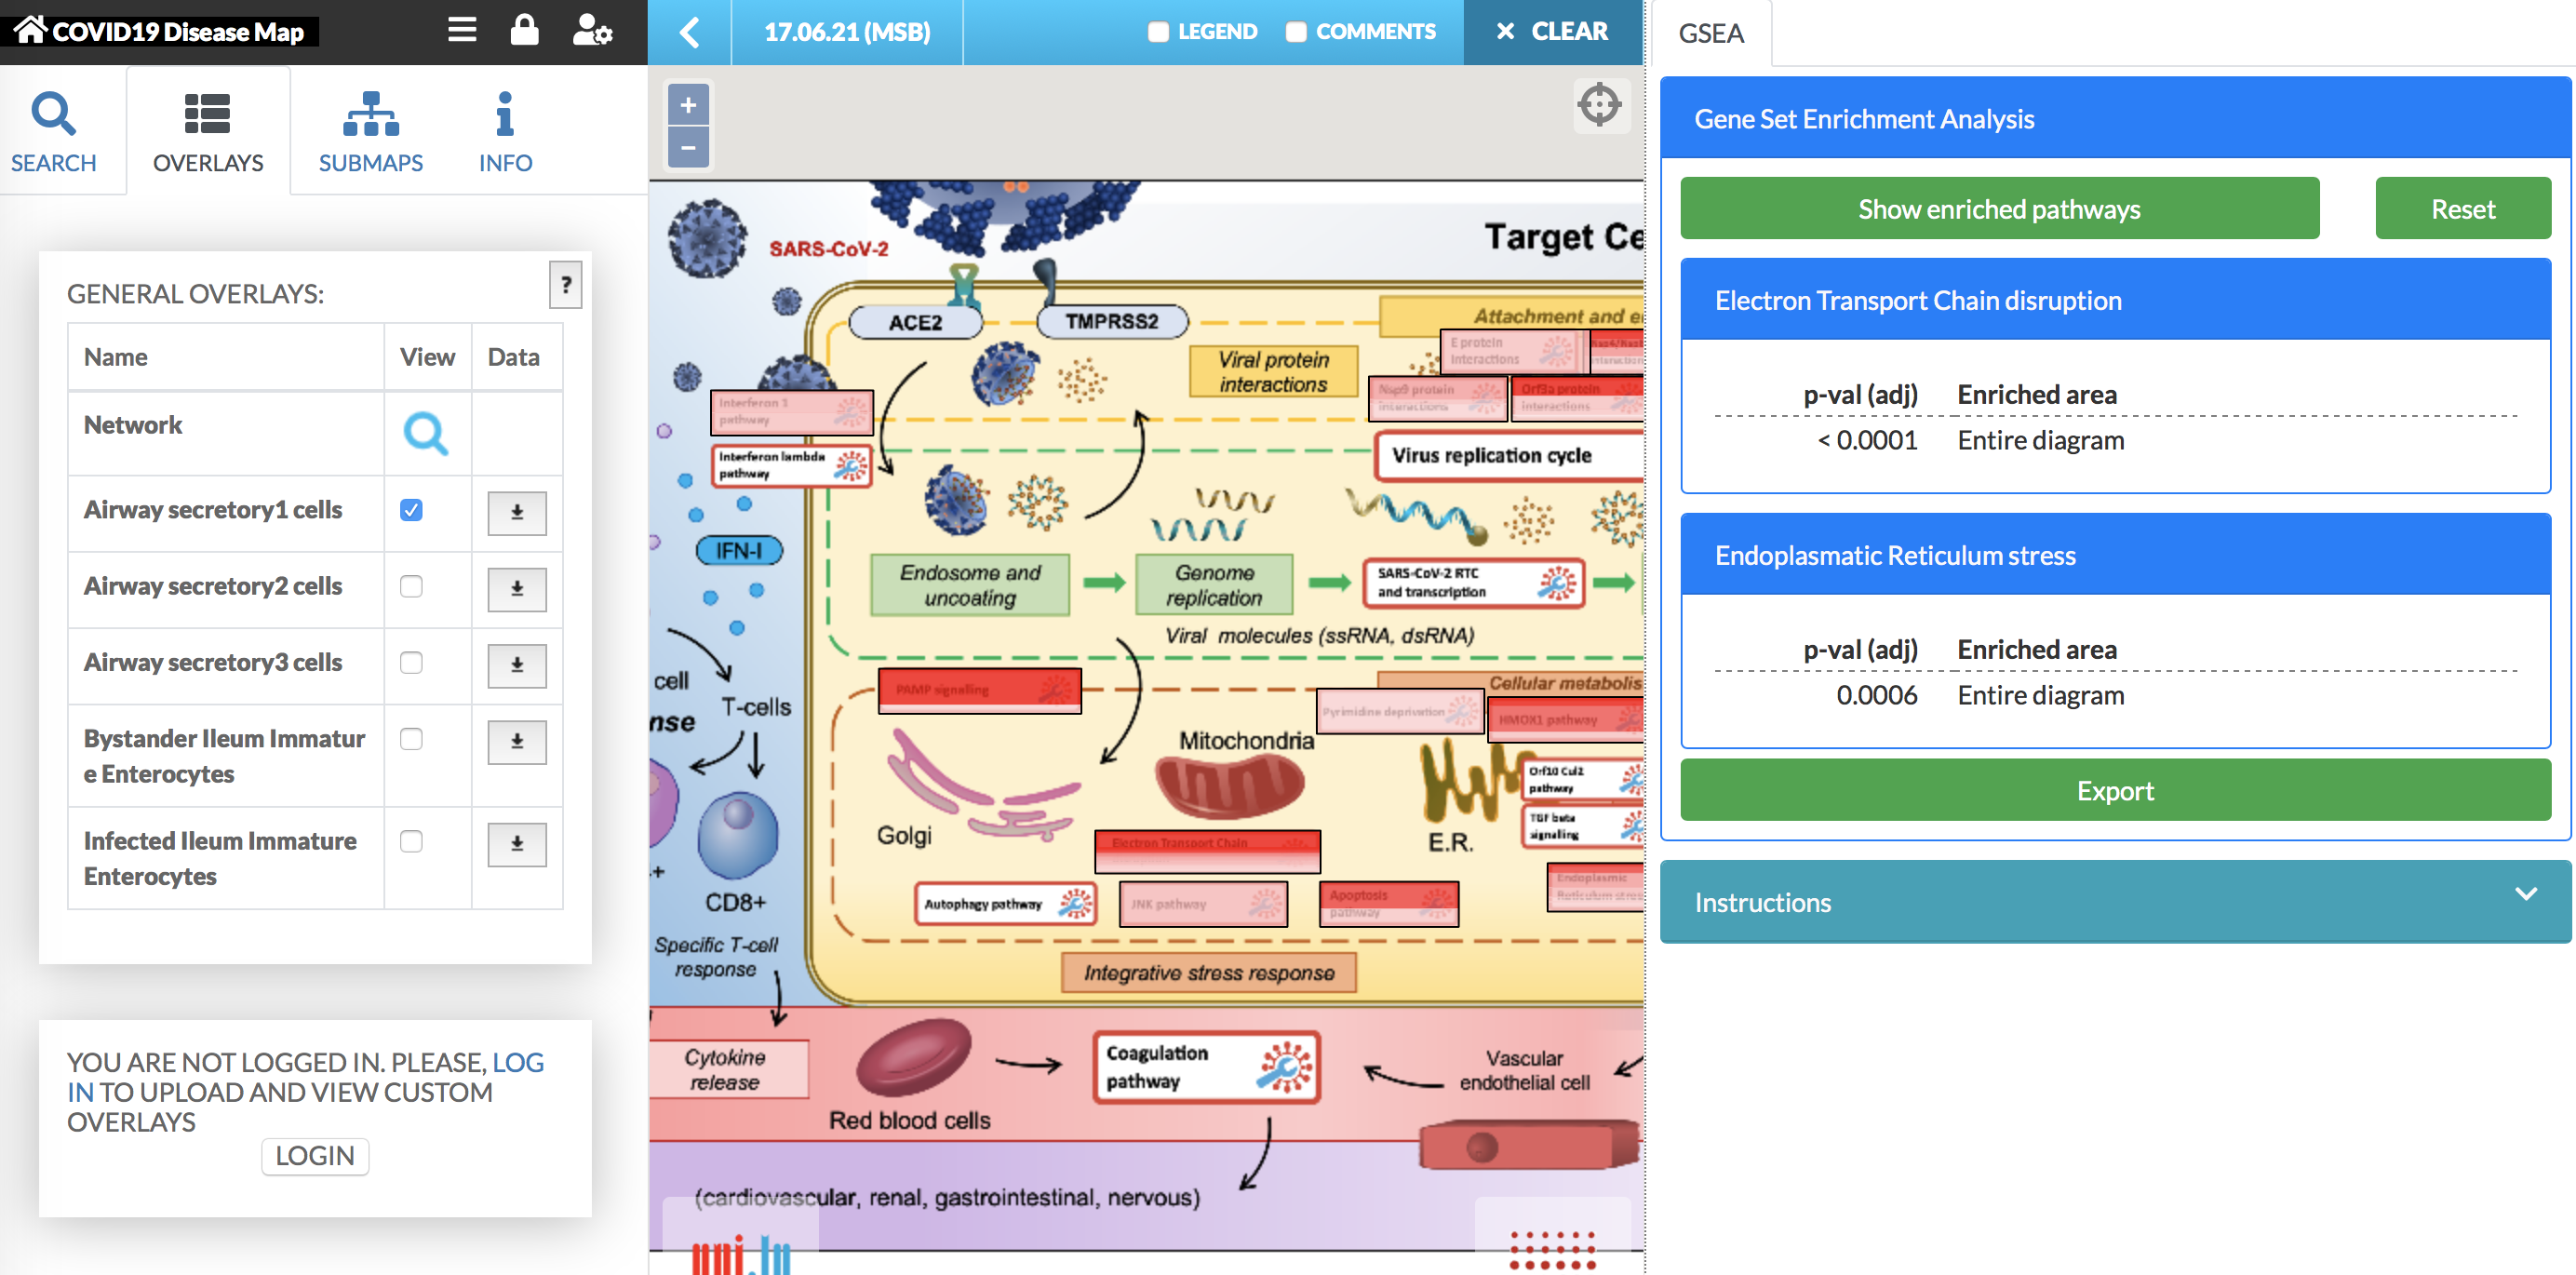
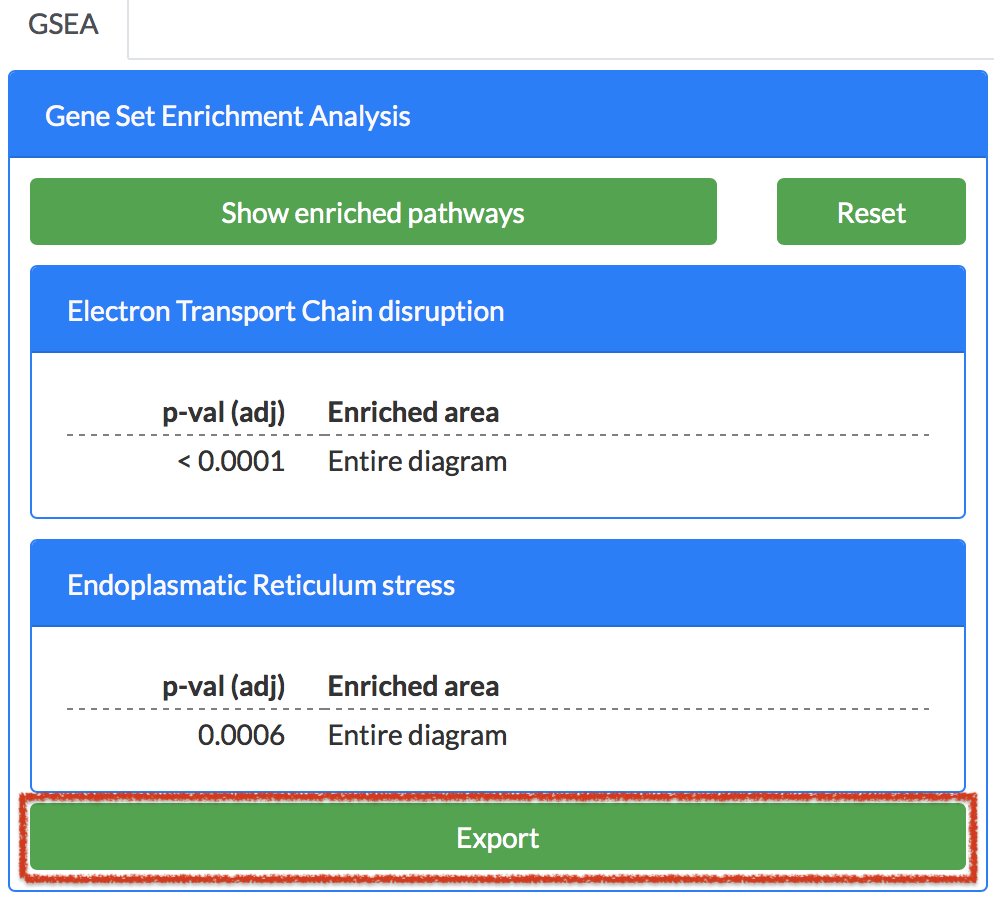
To start the analysis with the plugin, select from the left panel the overlay for which you would like to calculate the enrichment. Then, press the Show enriched pathways button in the plugin panel. The enrichment analysis is displayed in the plugin panel (see image below).
The results of the GSEA plugin:
- The results of the enrichment: the p-value is Bonferroni adjusted. The enriched area column contains the names of the submaps or pathways, which are enriched in the considered overlay. [comment]: Enriched areas are highlighted in the map.
- If multiple overlays are selected, the enrichment will be calculated for the union of the corresponding gene sets.
At the bottom of the GSEA plugin panel, there is Export button. Click on it, to export the enrichment results as json file or tsv (tab separated values) file.
To close the plugins panel you have to unload the plugin. To so that, click the plugins icon, the plugins popup window will be displayed. Click UNLOAD button. (see images below)
How to get MINERVA Platform account#
MINERVA Platform account provides users with more options, like uploading own omics data, accessing maps hosted on the instance or managing map’s details and privileges. If you would like to get MINERVA Platform account, go to INFO tab in Left Panel. There is a hyperlink ‘Request an account’ - click on it and send an email with the request.